Layer types
cartokit ships with a compact core of common cartographic forms, with
support for transitioning between forms without transforming your data.
As a tool for interactive cartography, cartokit adopts the language of cartographers to describe layers on your map. Rather than focusing on the appearance of individual marks, cartokit gives each layer a type that corresponds to a particular cartographic form. A layer’s type determines not only which of its visual attributes can be styled, but also how data is mapped to particular attributes for display.
Layer types
Section titled “Layer types”cartokit currently supports six layer types. The available layer types for a given layer are dependent on the geometry of the input data.
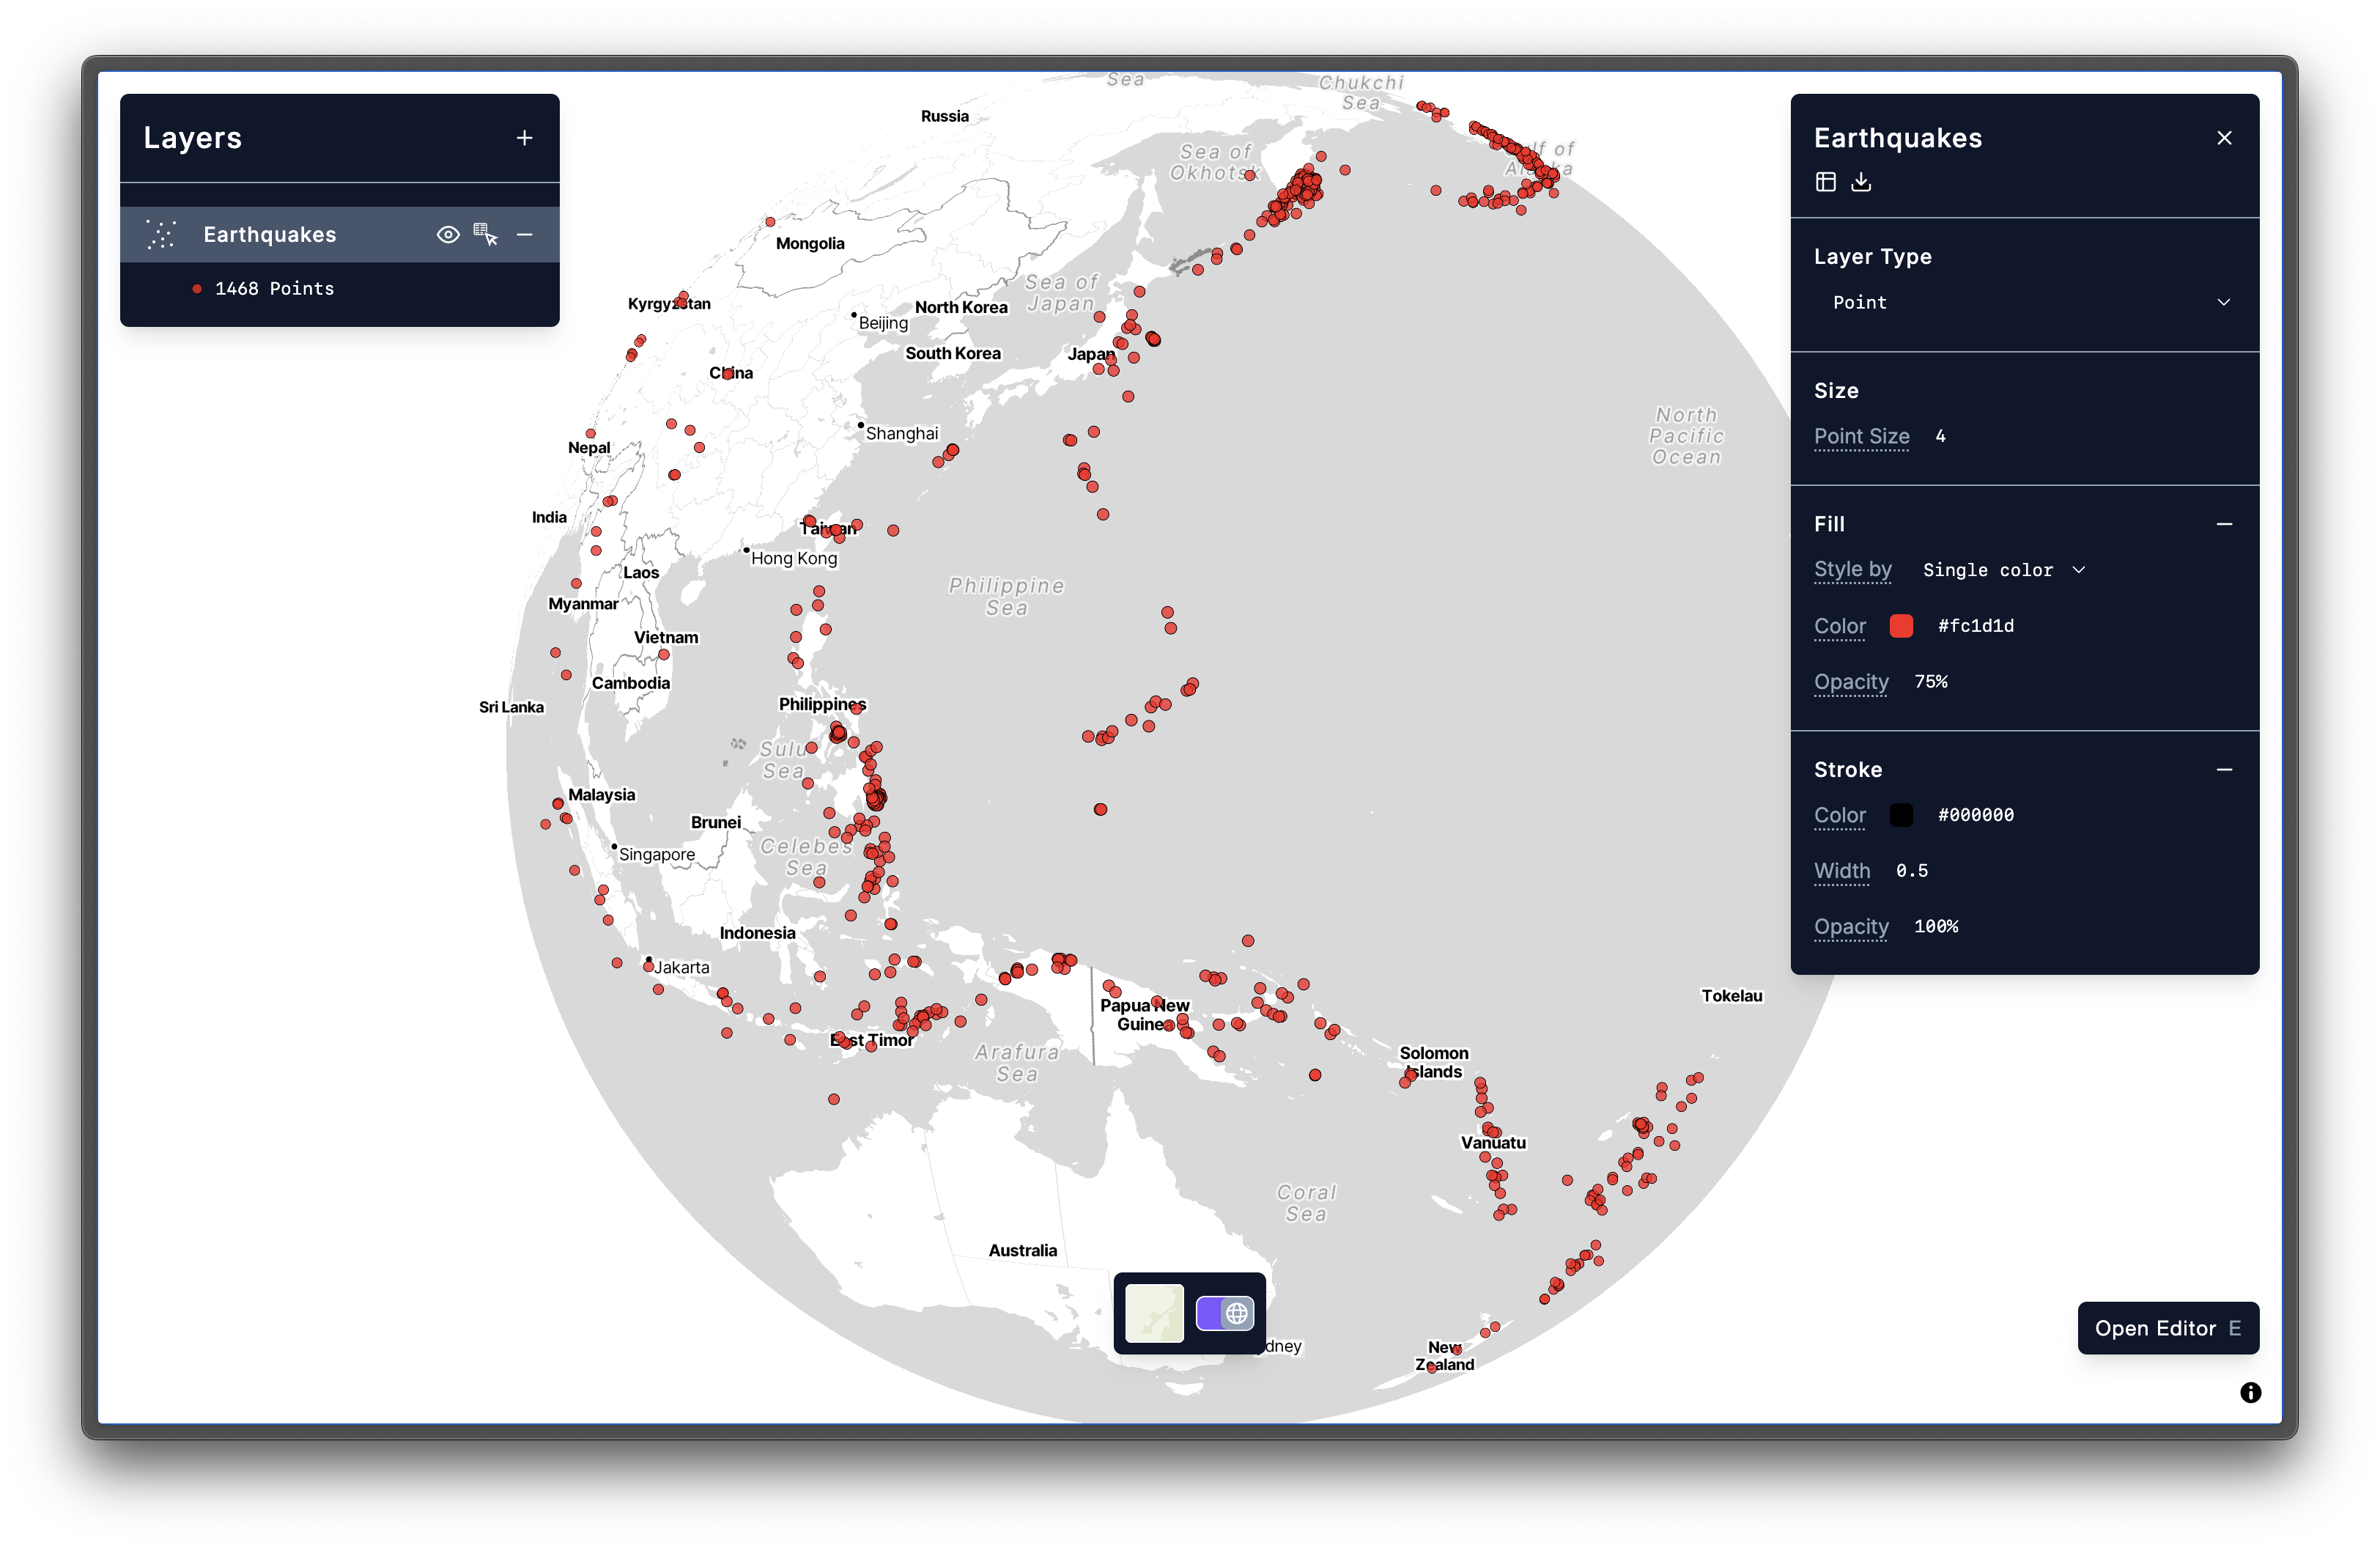
The Point layer type displays all features of a layer as points with a consistent, configurable radius. This type is the default type for Point and MultiPoint GeoJSON datasets.
Supported Input Geometries
Section titled “Supported Input Geometries”PointMultiPointPolygon(uses centroid)MultiPolygon(uses centroid)LineString(uses centroid)MultiLineString(uses centroid)
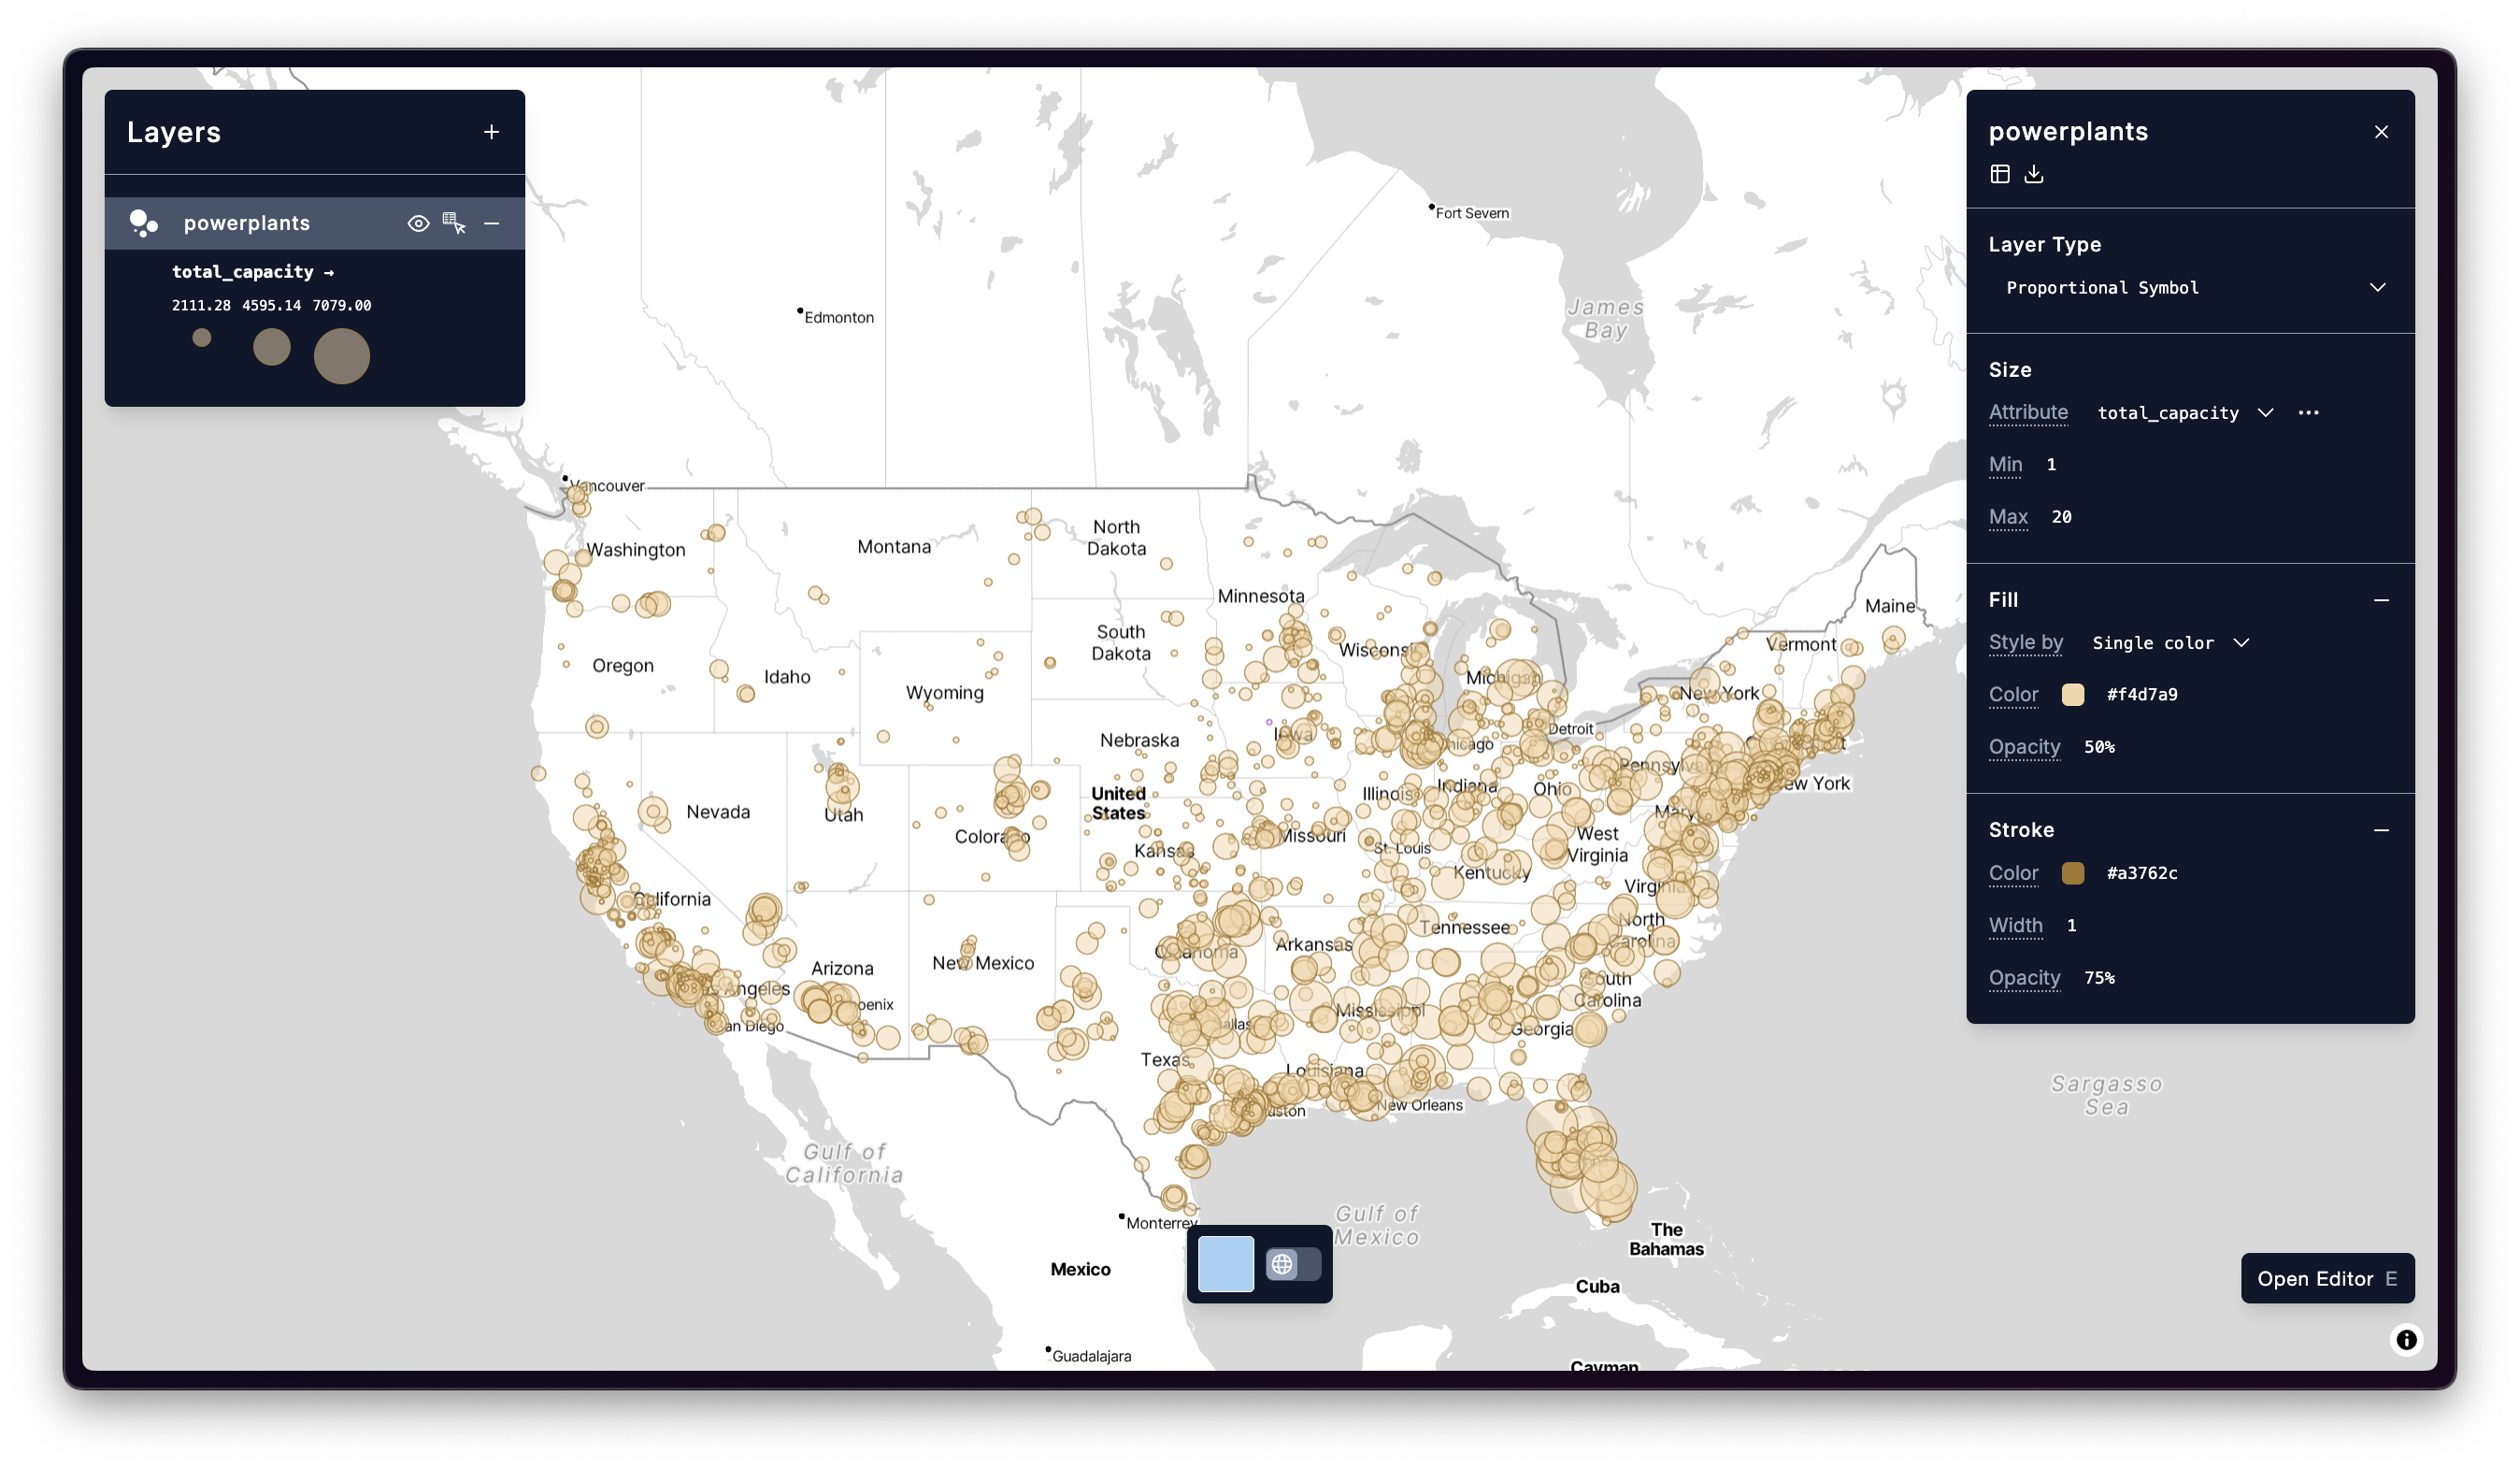
Proportional Symbol
Section titled “Proportional Symbol”The Proportional Symbol layer type allows scaling of point symbols based on the value of a selected attribute for each data point.
Supported Input Geometries
Section titled “Supported Input Geometries”PointMultiPointPolygon(uses centroid)MultiPolygon(uses centroid)LineString(uses centroid)MultiLineString(uses centroid)
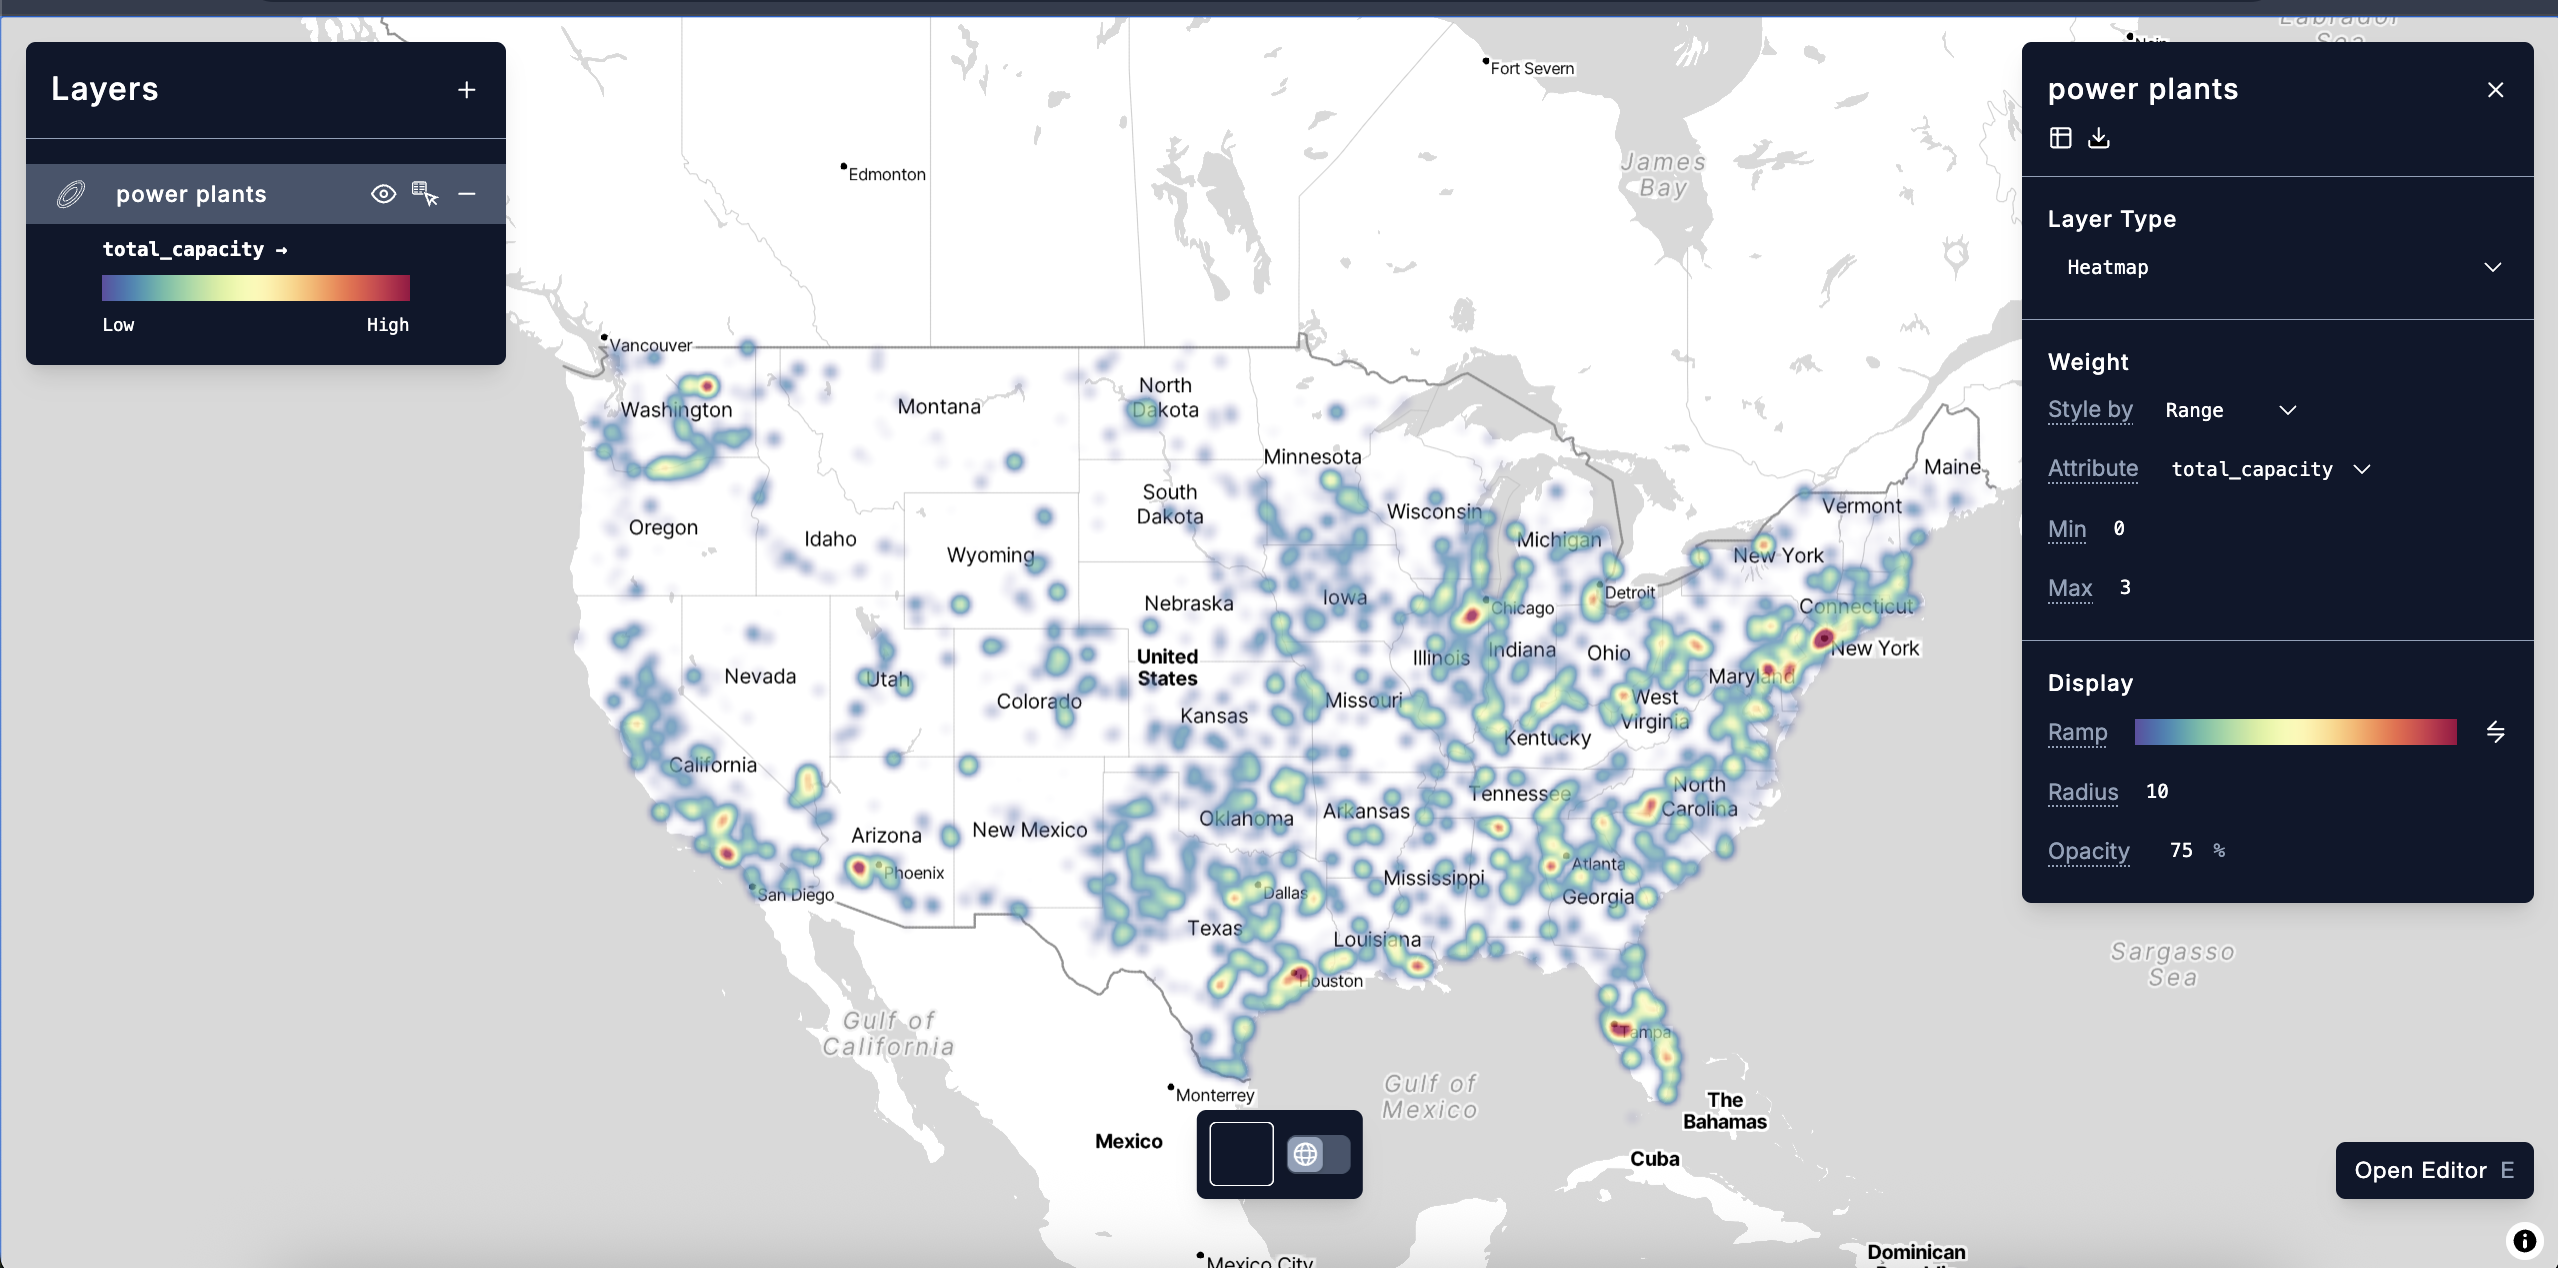
Heatmap
Section titled “Heatmap”The Heatmap layer type displays the density of data using a color gradient with intensity styled by a Constant concentration of points or weighted Range of a selected attribute value.
Supported Input Geometries
Section titled “Supported Input Geometries”PointMultiPoint
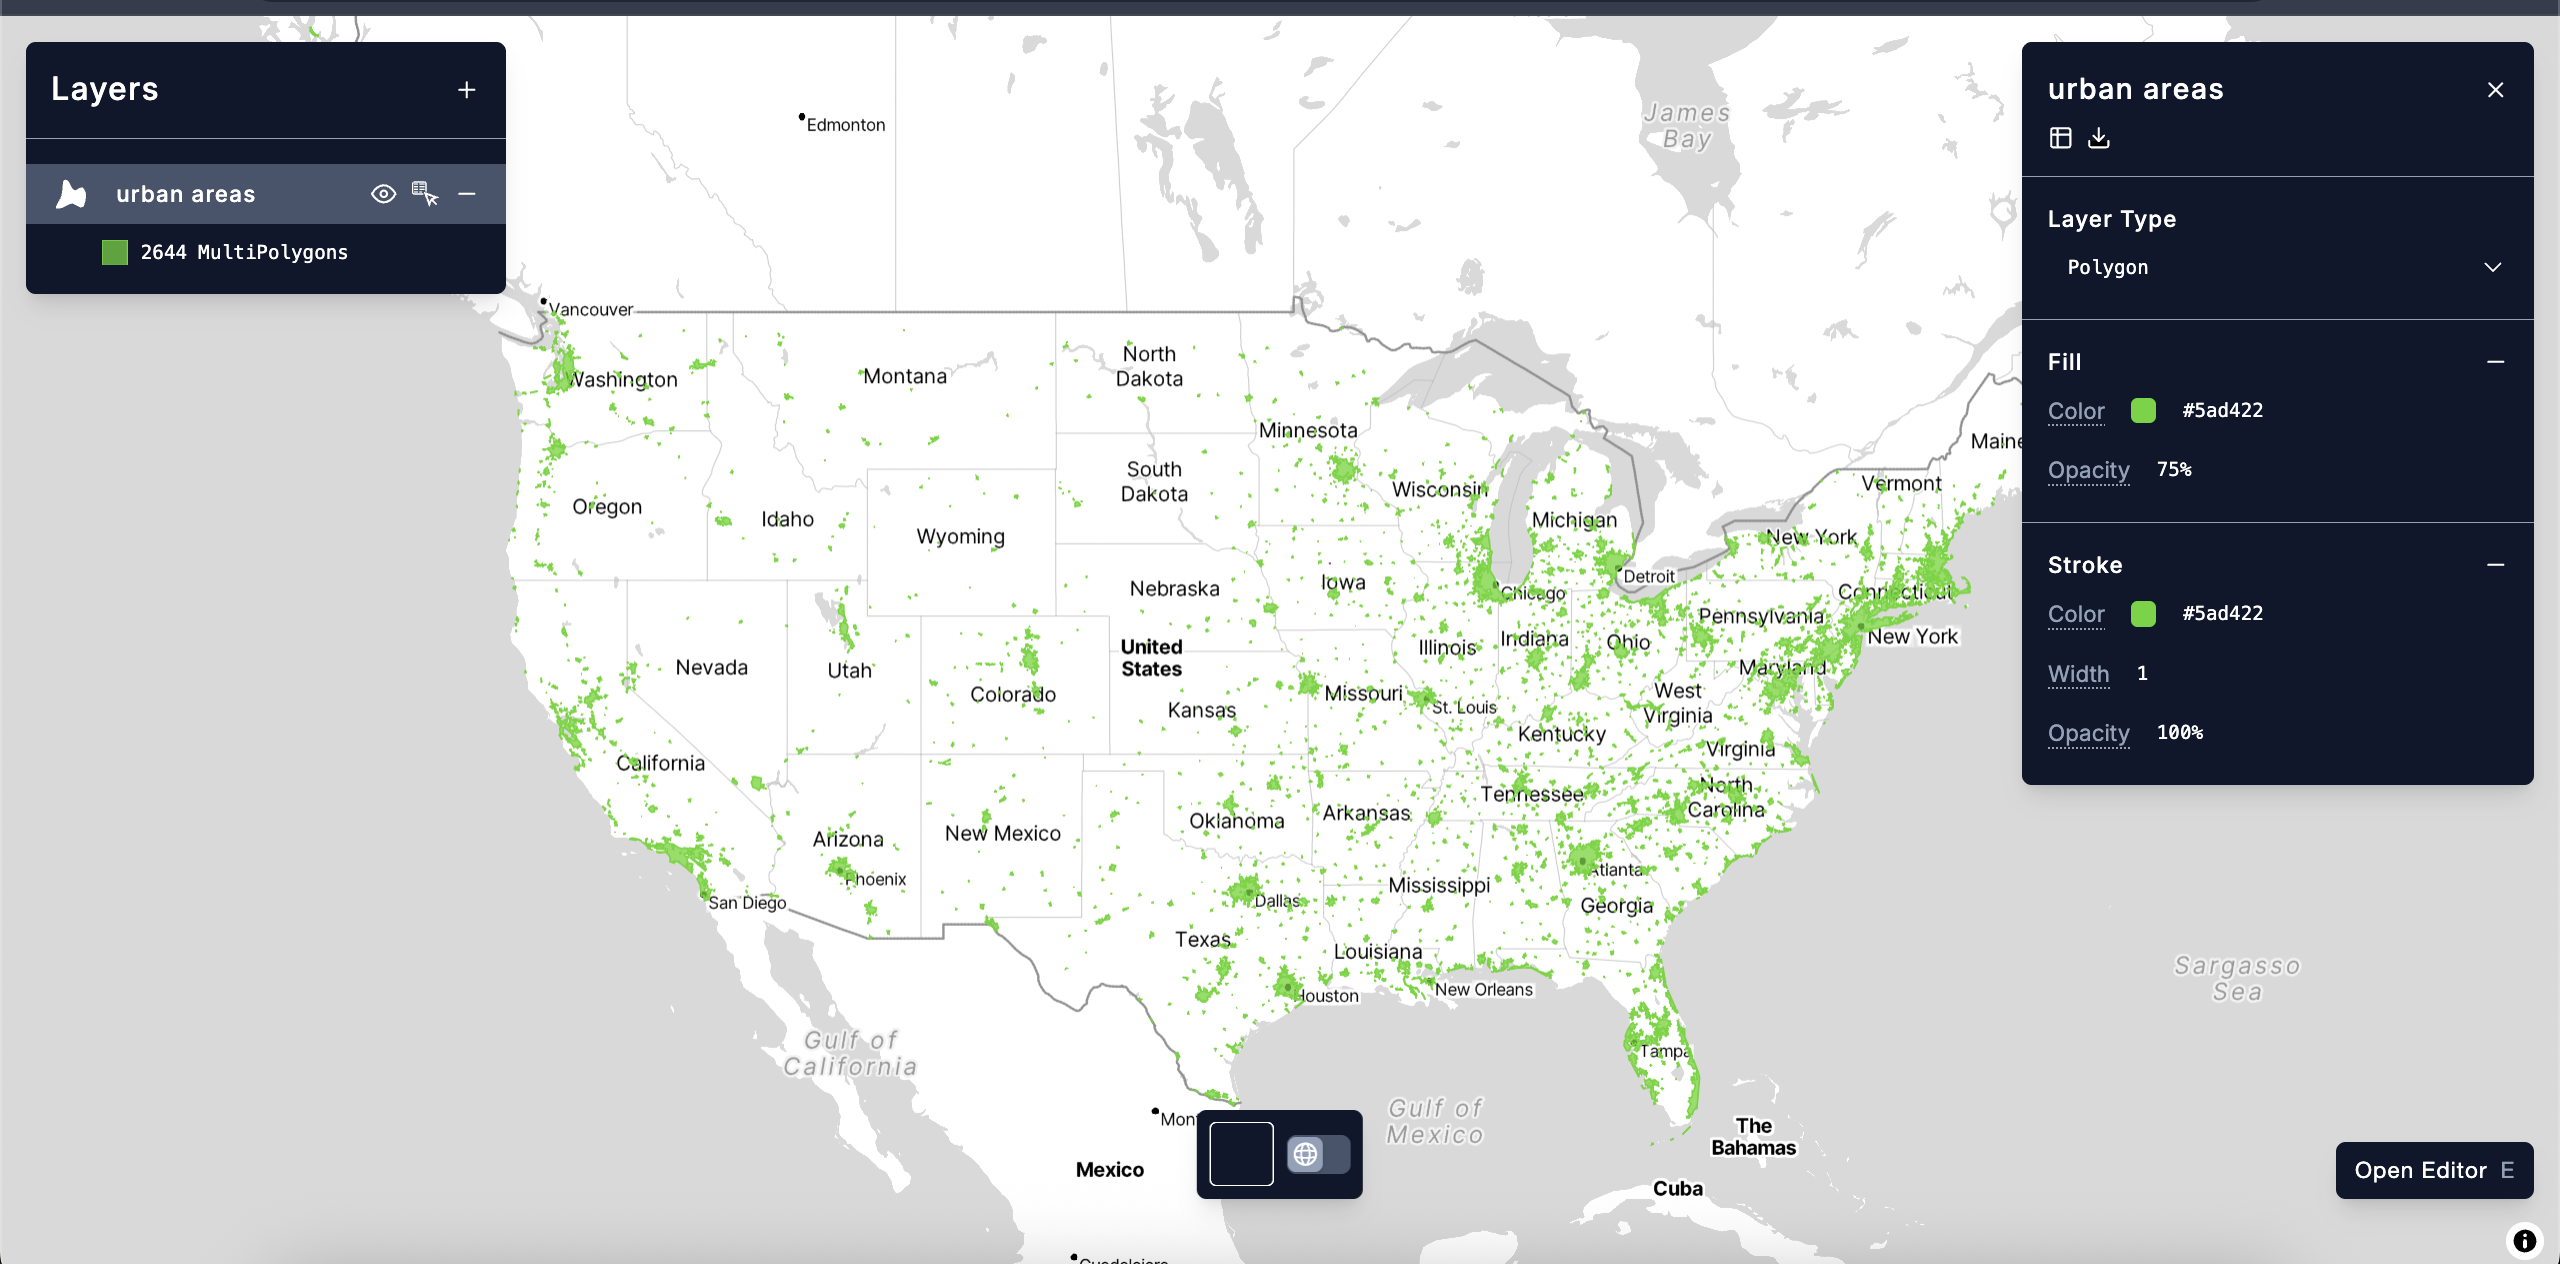
Polygon
Section titled “Polygon”The Polygon layer type displays geographic areas as filled shapes with configurable fill color and border style. This type is the default type for Polygon and MultiPolygon GeoJSON datasets.
Supported Input Geometries
Section titled “Supported Input Geometries”PolygonMultiPolygon
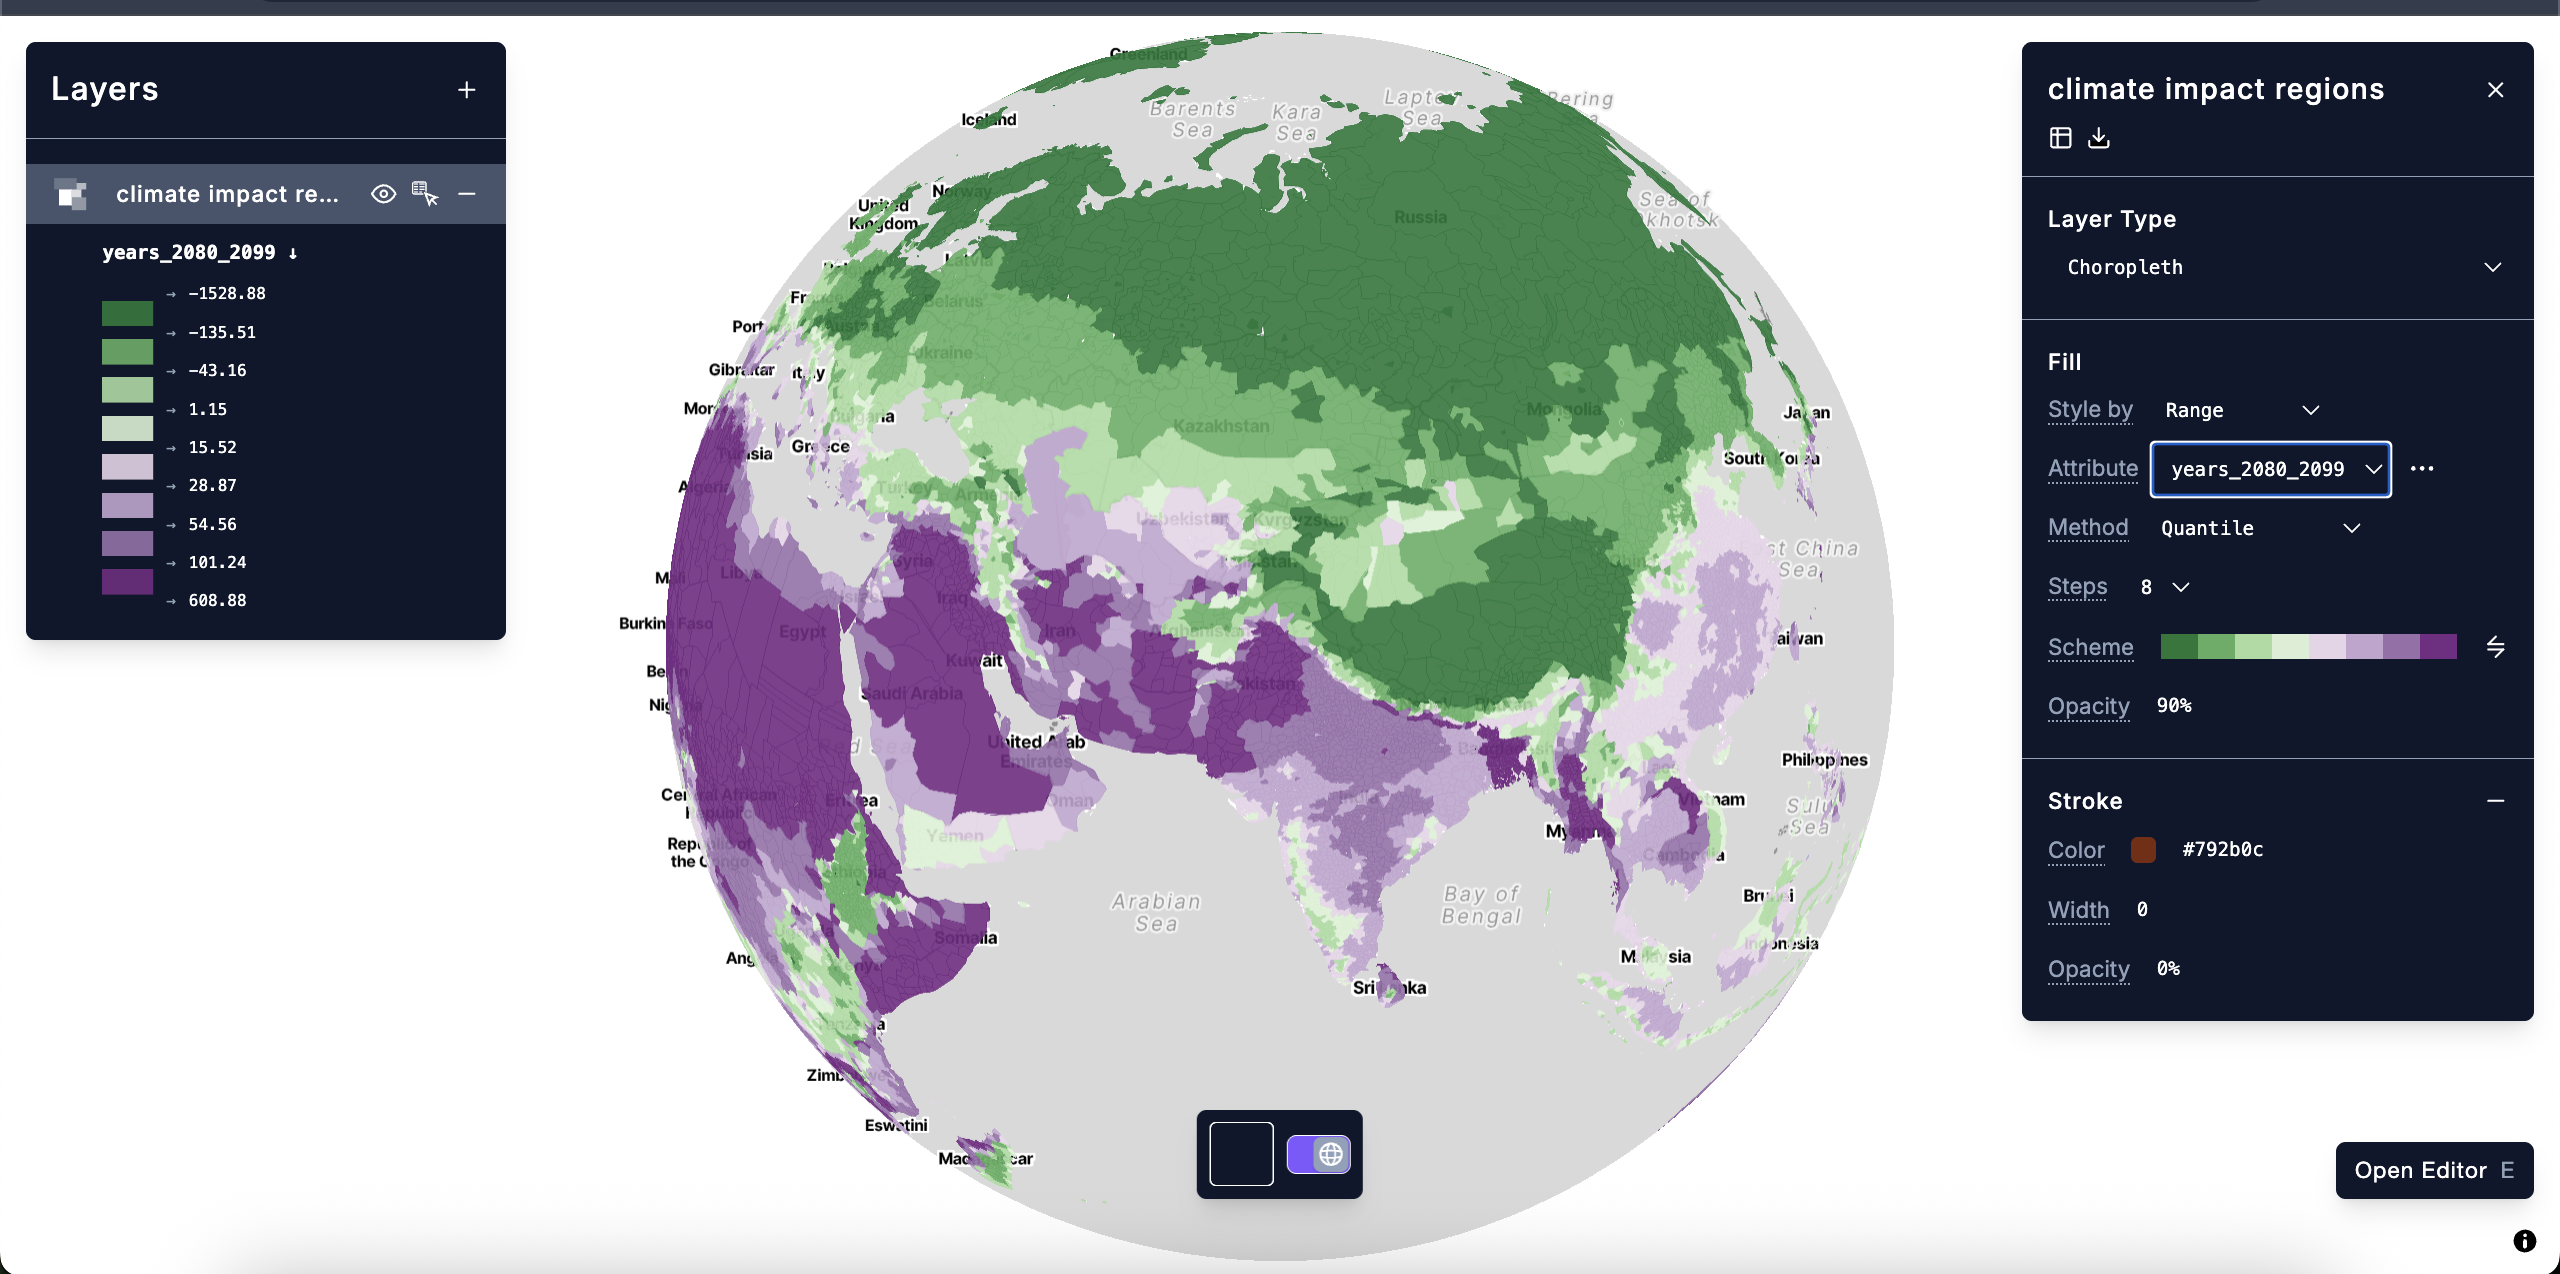
Choropleth
Section titled “Choropleth”The Choropleth layer type colors polygons based on the value of a selected attribute, using either Categories or a numerical Range with a configurable scale.
Supported Input Geometries
Section titled “Supported Input Geometries”PolygonMultiPolygon
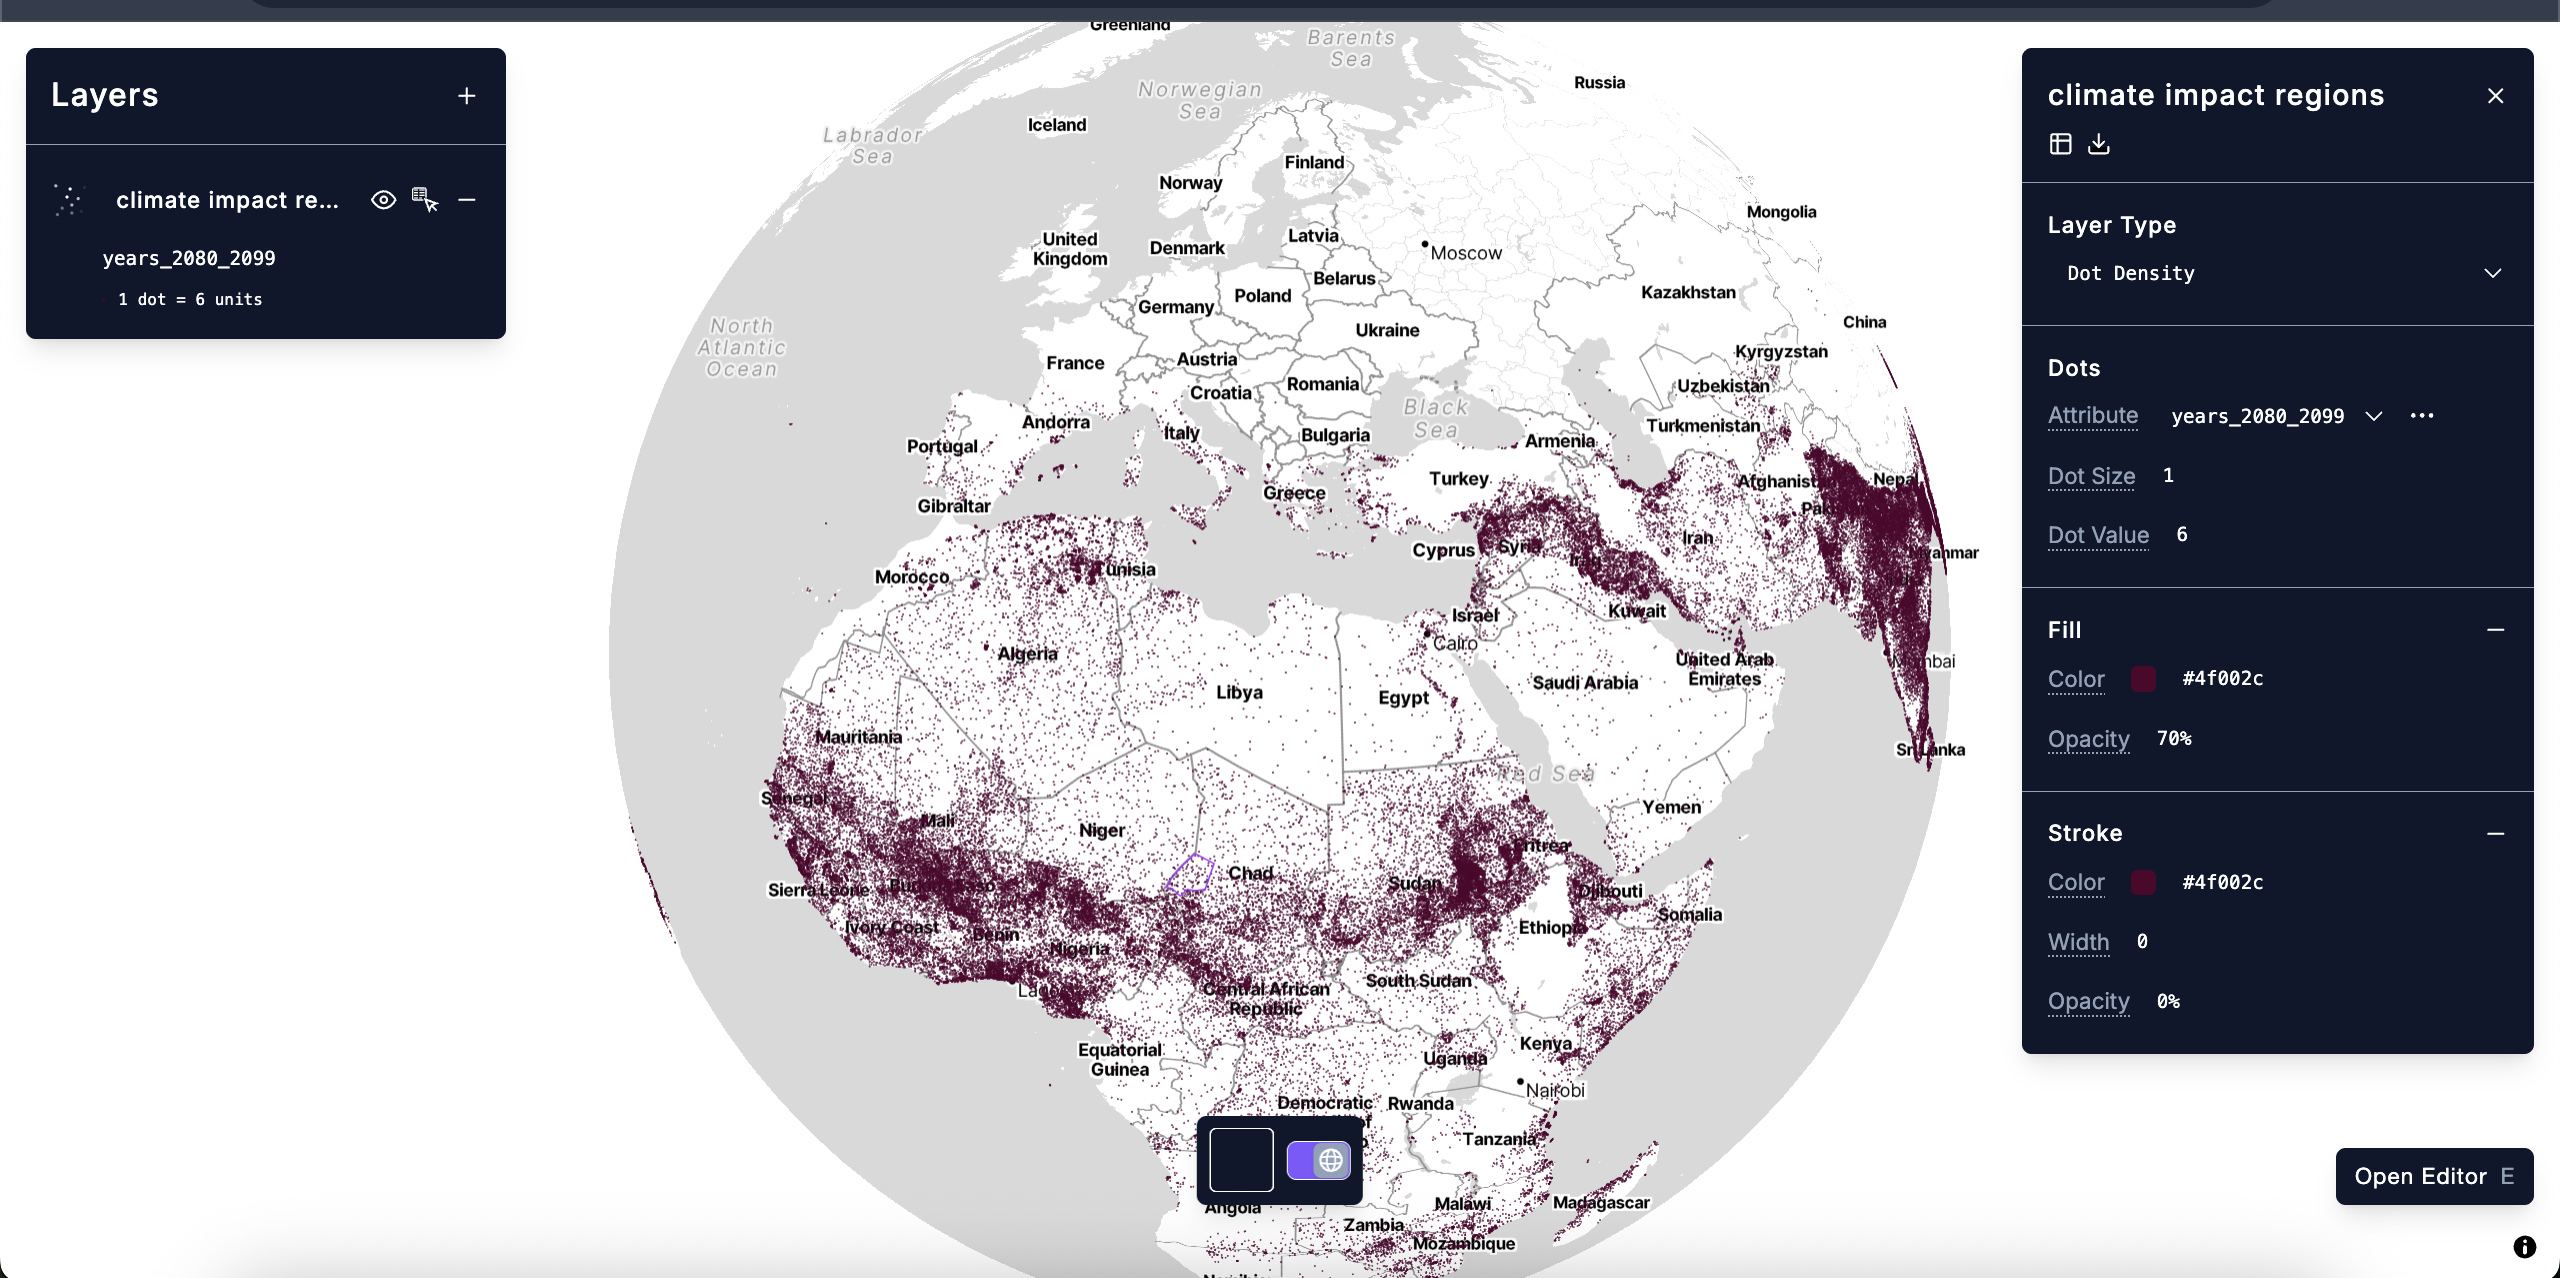
Dot Density
Section titled “Dot Density”The Dot Density layer type distributes points within polygon boundaries, with the number of points proportional to a selected attribute value.
Supported Input Geometries
Section titled “Supported Input Geometries”PolygonMultiPolygon
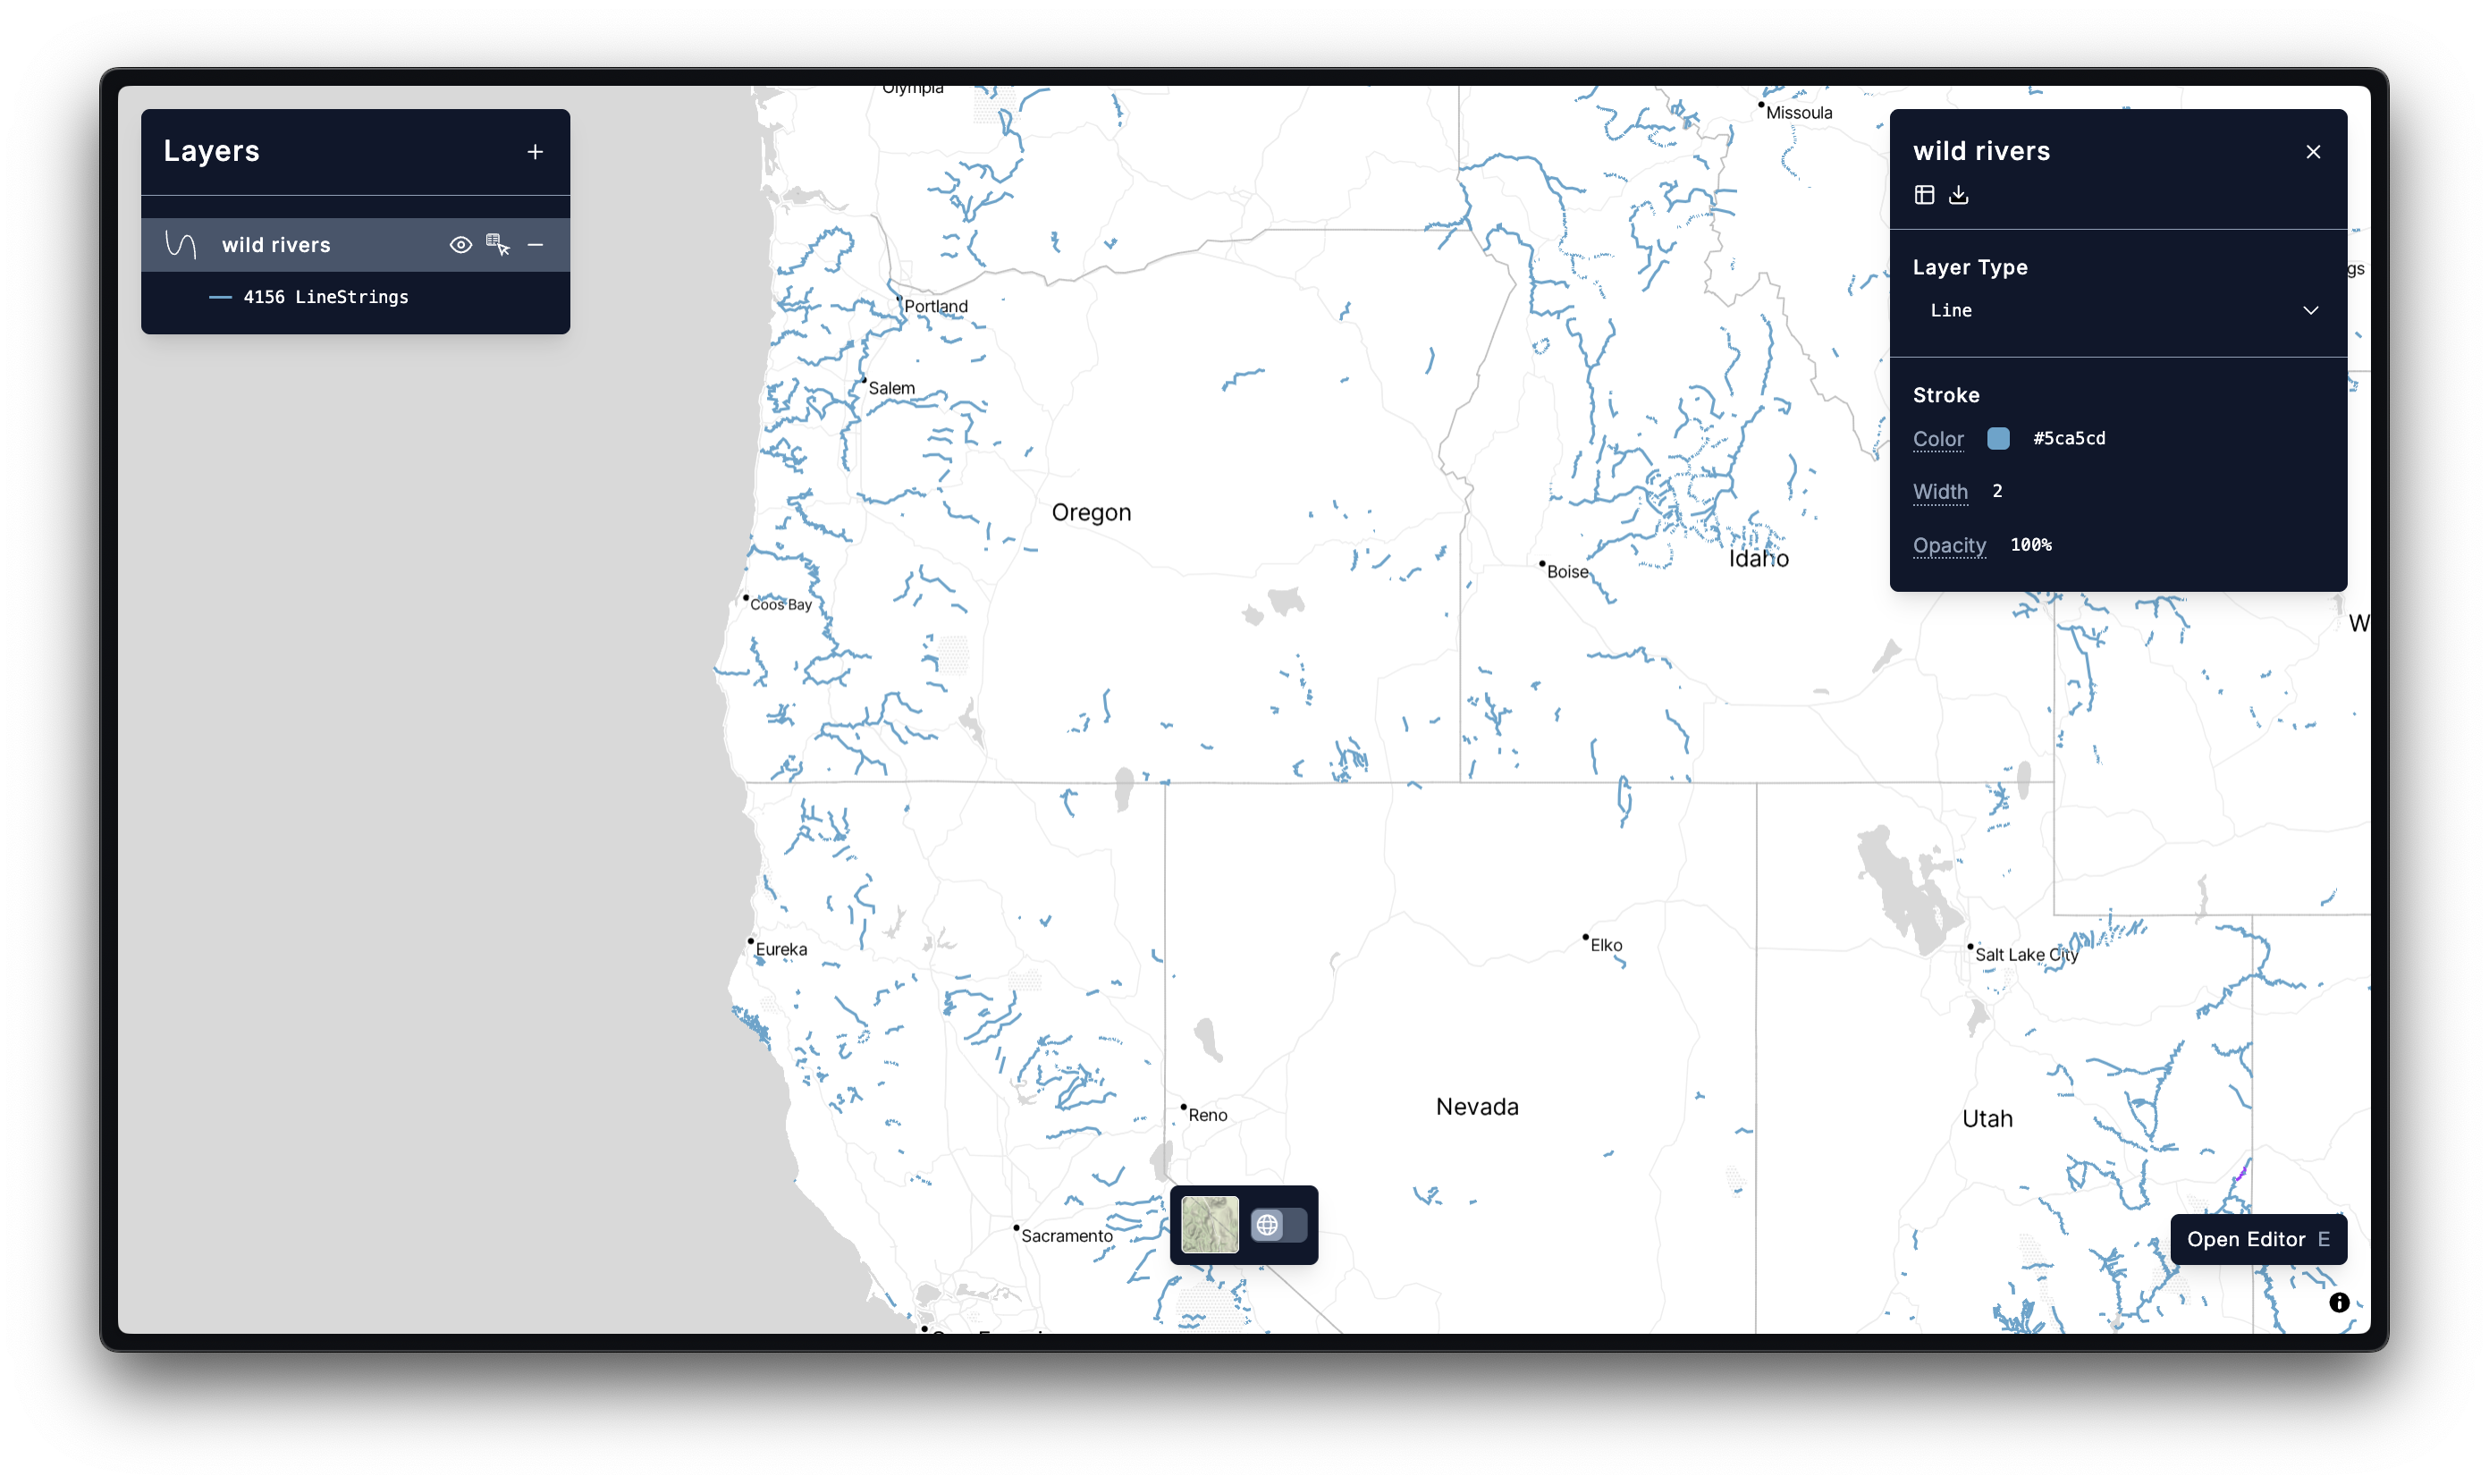
The Line layer type displays all features of a layer as lines with configurable stroke styling. This type is the default type for LineString and MultiLineString GeoJSON datasets.
Supported Input Geometries
Section titled “Supported Input Geometries”LineStringMultiLineString